2.1.2 - Quality analysis and preprocessing
To proceed with quality analysis and processing, go RNASeq Protocols → Step-by-Step Mode → Tophat/Hisat & Cufflinks Protocol. A submenu will appear in the workspace showing the following tabs: Preprocessing, Mapping, Transcriptome Assembly, Differential Expression test, and GOseq. Each tab references to a step of the DE analysis protocol with its reference genome and annotation file correspondent.
- Quality analysis
For the quality analysis we will use FASTQC (Andrews, 2016). To access the interface of FASTQ in RNASeq, go to the step-by-step menu path Tophat/Hisat2 & Cufflinks Preprocessing → Quality Analysis → FASTQC and proceed as shown in Video 2.
Video 2. Performing a quality analysis with FASTQC.
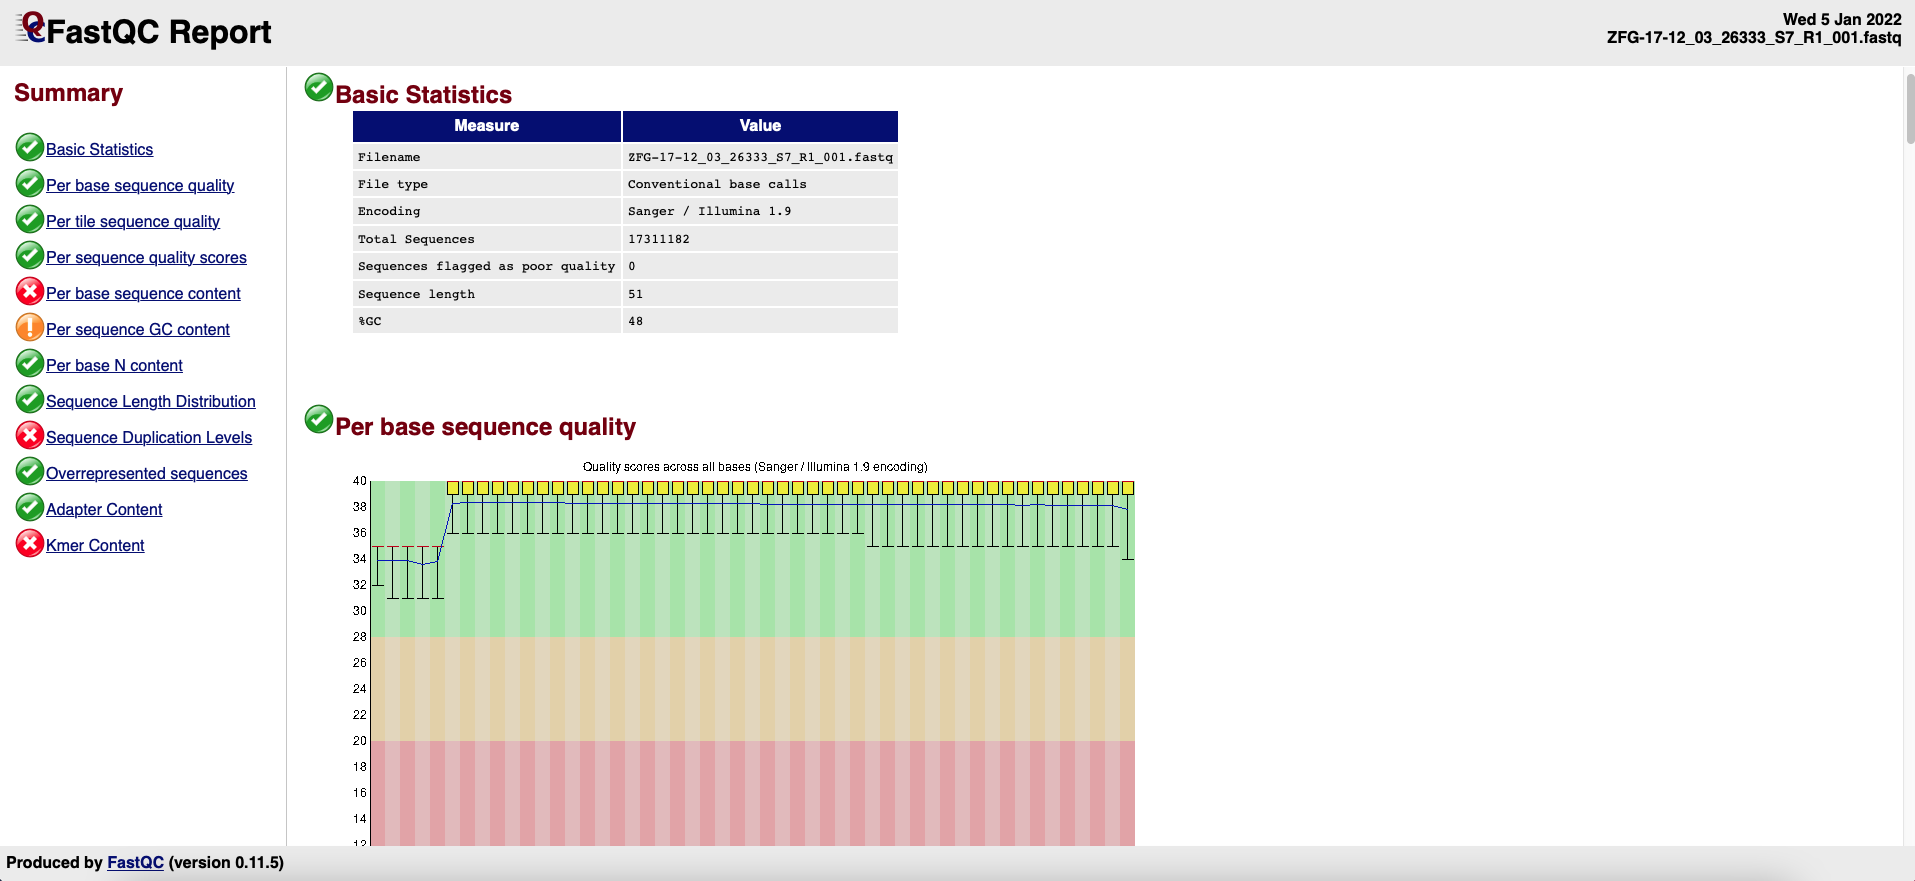
A FastQC report is a html file (Figure 2) containing the sections detailed below the figure and that can be used to check the quality of a sample:
Figure 2. FASTQC Report example.-
Basic Statistics: general information on the input FASTQ file such as sample name, type of quality score encoding, the total number of reads, read length, and GC content.
-
Per base sequence quality: a box-and-whisker plot showing aggregated quality score statistics for every position along all reads in the file.
-
Per tile sequence quality: this graph will only appear in your results if you are using an Illumina library that retains its original sequence identifiers. The graph allows you to look at the quality scores from each tile across all bases to see if there was a loss in the quality at only one part of the flowcell.
-
Per sequence quality scores: a plot of the total number of reads vs. the average quality score over the full length of that read
-
Per base sequence content: this plot reports the percent of bases called for each of the four nucleotides at each position across all reads in the file.
-
Per sequence GC content: plot of the number of reads vs. GC% per read. The displayed Theoretical Distribution assumes a uniform GC content for all reads.
-
Per base N content: percent of bases at each position or bin with no base call, i.e., ‘N’.
-
Sequence Length Distribution: plot showing the distribution of fragment sizes.
-
Sequence Duplication Levels: percentage of reads of a specific sequence in the file that are present a given number of times in the file.
-
Overrepresented sequences: list of sequences that appear more than expected in the file. Only the first 50bp are analyzed. A sequence is considered overrepresented if it accounts for ≥ 0.1% of the total reads. Each overrepresented sequence is compared to a list of common contaminants to help with identification.
-
Adapter Content: cumulative plot of the fraction of reads where the sequence library adapter sequence is identified at the indicated base position. Only adapters specific to the library type are searched
-
Kmer Content: measures the count of each short nucleotide of length k (default = 7) starting at each position along the read. Any given Kmer should be evenly represented across the length of the read.
|
Expected results When FASTQC finishes, you will obtain a report for each fastq file
in your output folder. The expected results are available at Quality Analysis For more details on the FASTQC report, visit https://www.bioinformatics.babraham.ac.uk/projects/fastqc/ |
|---|
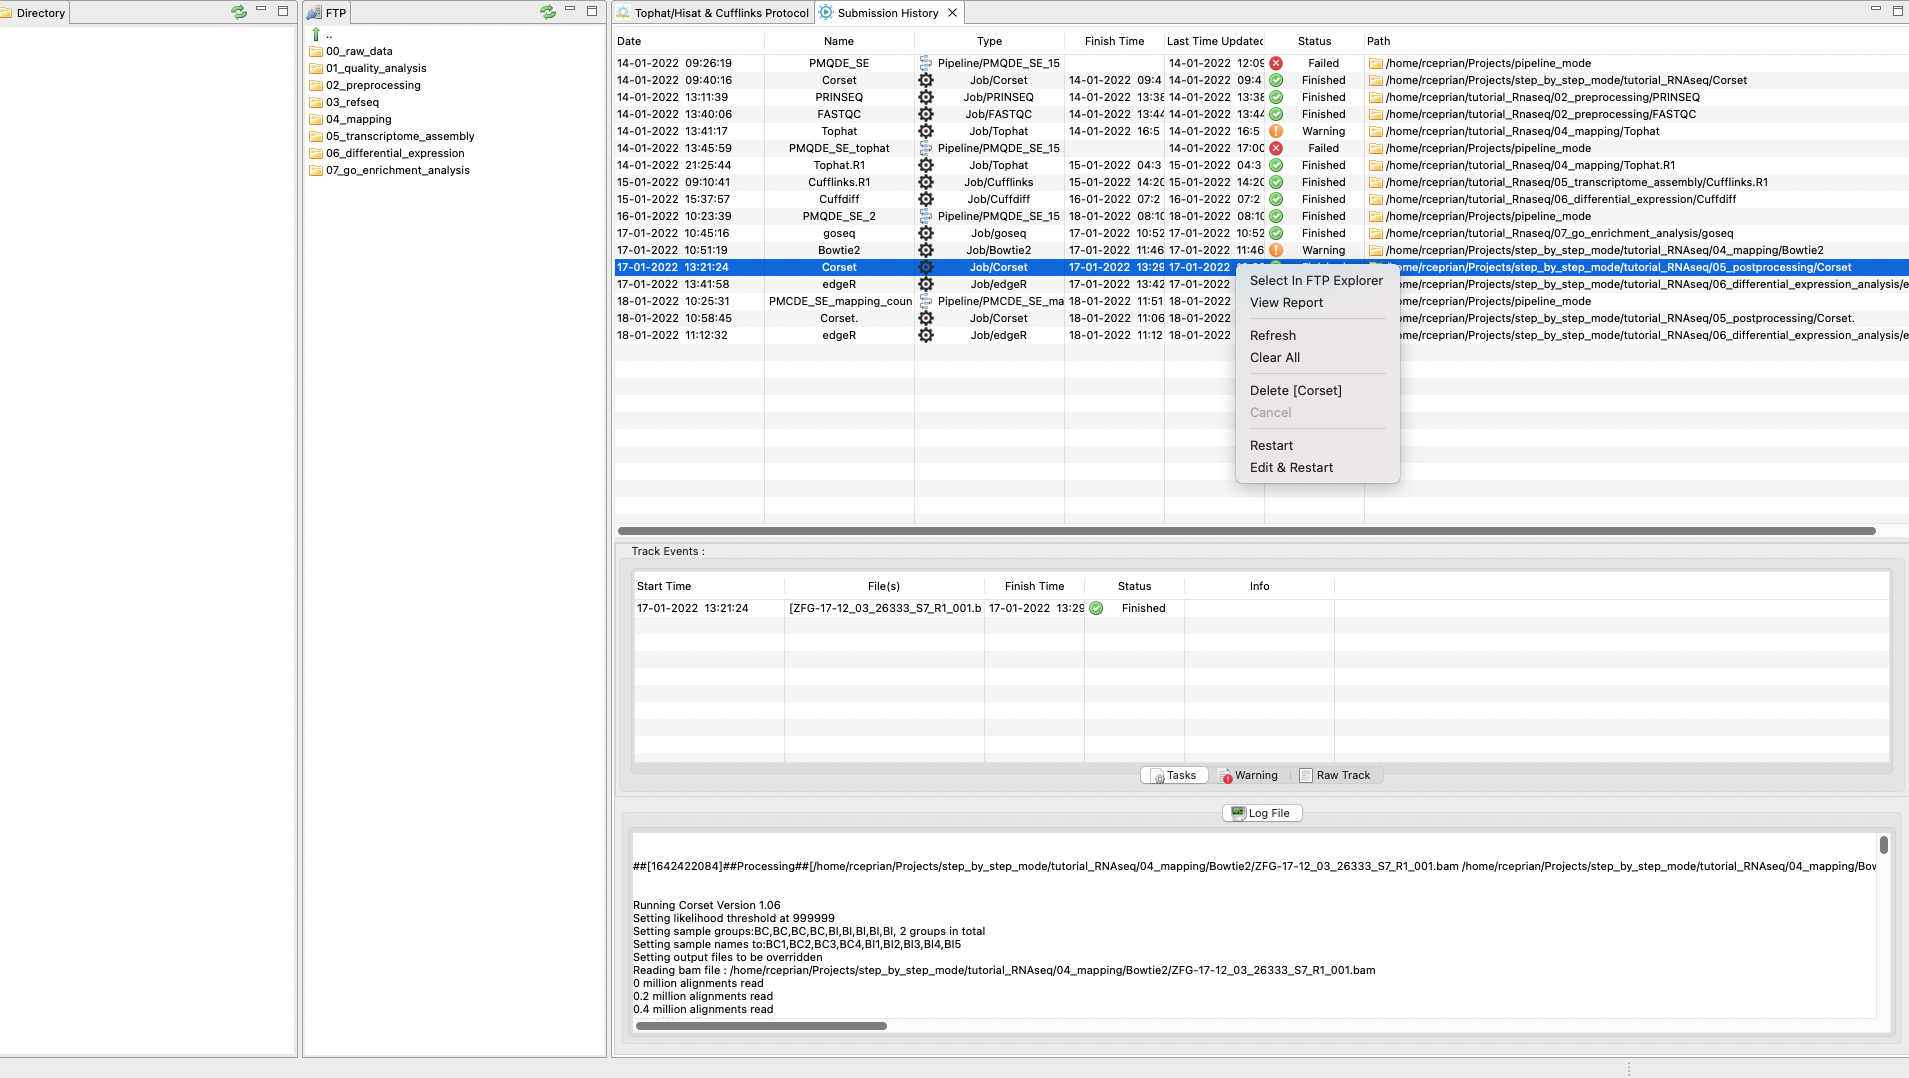
You can check the status of the quality analysis in the main menu under Pipelines Jobs → Job Tracking System and clicking on the tracking panel (Figure 3). By right clicking on the panel, you can update, clear, or delete a process. You can also see a log file of the process to check if something failed or which commands were used in the analysis. Finally, you can even rerun an analysis directly from the tracking panel.

Figure 3. Tracking
panel to see the status of each job executed by RNAseq on the server side.
- Preprocessing
Once the quality analysis has finished, the next step of the protocol is to preprocess the fastq files (from BI1-BI5 and BC1-BC4) with low quality sequences.
- Filter samples with PRINSEQTo apply filters and clean your fastq files (from BI1-BI5 and BC1-BC4), you can use PRINSEQ (Schmieder and Edwards, 2011). You can filter all samples by quality, size, and Ns content. To do this, go to the Step-by-step menu path Tophat/Hisat2 & Cufflinks → Preprocessing → Trimming & Cleaning → PRINSEQ and do as indicate in Video 3.
Video 3. Filter samples by quality, size, and Ns content with PRINSEQ.
Optional: you can repeat the FASTQC quality analysis to check if the PRINSEQ removed all sequencing artifacts and if necessary, execute PRINSEQ again.
|
Expected results from the PRINSEQ preprocessing analysis When PRINSEQ is done you will receive your fastq libraries free of adapters in your output folder. The expected results of this step are available in the following link PRINSEQ Remember you can check if the job was successfully completed by accessing the job tracking panel of RNASeq To know more about PRINSEQ see, http://prinseq.sourceforge.net |
|---|
NOTES: The exact methods used for preprocessing depends on personal preference: in this case, we use PRINSEQ, but you would have also to use TRIMMOMATIC (Bolger et al., 2014),
CUTADAPT (Martin 2011) and other parameters


